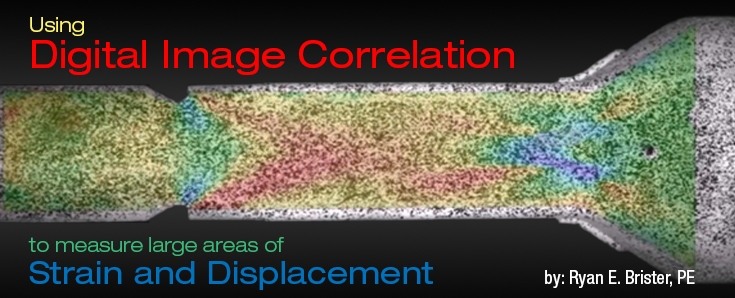
Using Digital Image Correlation to Measure Large Areas of Strain and Displacement
During component testing, strain and displacement data are often critical for fully documenting the behavior of the component. Strain is typically measured using bonded strain gages while displacement is measured with a string potentiometer or a linear variable differential transformer (LVDT). While these devices are often useful, they have limited capability in certain situations and testing scenarios.
A single-element strain gage will only provide the strain in the grid direction. Any displacement not in the measurement direction will not be directly obtained and, in many cases, adversely affect the actual measurement. Multiple strain gages or a gage rosette are needed to extract principal strains and directions. Strain gages must be bonded to a clean surface, which often requires removing material in the gage area. Further, the measurement area of interest must be determined prior to testing so that the strain gage can be installed in the required location. Measurement areas of interest are typically determined from analytical models which are often not 100% accurate, which then leads to issues in placing the strain gages. Depending on the local strain gradient, even slightly misplacing a strain gage can lead to dramatic differences between the actual strain and measured strain.
Digital Image Correlation (DIC) can be used to avoid these types of issues by measuring the surface displacement and strain over the entire area of interest. DIC utilizes optical photogrammetry techniques to obtain three-dimensional (3D) displacement measurements in six degrees of freedom (DOF) as well as surface strain measurements. DIC combines the functionality of a strain gage and displacement device into a single noncontact measurement system. A single DIC measurement will capture the entire surface strain field within the field of view (FOV), as well as any surface displacement in 3D. Multiple sequential DIC measurements will capture the surface acceleration and velocity of an object in 3D.
To implement DIC, a stochastic (random) pattern is applied to the surface of the test article, which is used as a reference surface for the measurement. A pair of specialized cameras are used to film the test article as it deforms under testing loads. The two cameras capture images of the test article before, during, and after the testing process. Advanced software tracks the unique surface patterns and develops a 3D mesh of the surface by using stereo-triangulation. The 3D, six DOF displacement and surface strains are then computed by comparing the newly generated surface mesh to the initial surface mesh. Figure 1 shows an example of DIC data obtained during a bolt torquing process. The surface strains are shown along with the displacement of the two contact surfaces of the wrench.

Figure 1: VME surface strain from DIC data.
Comparing DIC to Strain Gages
Surface Preparation
The surface preparation required for DIC is faster than a typical strain gage application and can cover a larger surface area. Ideally, both measurement techniques require clean surfaces that are free of loose particles and other material that could flake or fall off during testing (surface rust, pipe scale, brittle coatings, etc.). However, unlike typical strain gage applications, DIC does not require a perfectly smooth surface to obtain proper measurements and can measure surfaces with a surface roughness of greater than RMS 420. Extremely rough surfaces, such as RMS 900, may require a specific viewing angle and can limit the FOV.
Figure 2 is a photograph of the surface of an additively manufactured part after being prepped with strain gages and a stochastic pattern. Attaching the strain gages required local surface grinding to obtain proper adhesion, whereas the stochastic pattern was sprayed directly onto the surface without any additional surface preparation.

Figure 2: Strain gages and stochastic surface pattern on example test sample.
Measurement Area and Analysis Options
A typical strain gage grid covers an area of 0.125” x 0.180” or similar (Figure 3). As mentioned, a single strain gage grid will only measure the strain in a single direction at one location. To capture multiple directions, additional gages are required, with a minimum of three gages required to deduce the principal strain magnitudes and directions.
With the same measurement size as the example gage above, a 12-megapixel DIC system provides a FOV of 7.75” x 5.5”, which is approximately 2,000 times the area of measurement of a single strain gage. This means that instead of a single gage that only measures a single strain direction, there are approximately 2,000 equivalent “virtual” strain gages that can measure strains in any surface direction.

Figure 3: Strain Gage Layout
Figure 4 shows an example of a virtual strain gage field and the DIC inspection process. This video highlights several standard analysis features including longitudinal, transverse, and von Mises strain fields. It also demonstrates the use of various inspection components that can be created anywhere on the surface at any time during the analysis process, including strain values at specific locations, average strain in areas of interest, and virtual extensometers.
Figure 4: DIC Virtual Strain Gage Field and Analysis
Measurement Accuracy
Both strain gages and DIC measurements can provide accurate information with proper calibration and set-up. At strains less than 0.03% (300 µε), strain gages typically provide higher accuracy than DIC. Accuracies of 0.5% to 1% are typical for strain gages with a measurement limit of up to 5% strain (50,000 µε). The accuracy of DIC strain measurements tends to be around 10% below 0.3% strain (3,000 µe), with higher accuracies near 1% above 3% strain (30,000 µe). DIC strain measurement has been successfully tested to beyond 50% strain, with some applications achieving 100% strain. Figure 5 provides an example of the strain limits of a strain gage versus DIC.

Figure 5: Strain Gage vs DIC Strain Limit
Measurement Rate
The measurement rate of DIC is limited by the imaging equipment. Most sensors are capable of imaging at frequencies below 100 Hz. High-speed sensors are available that can achieve framerates beyond 100,000 Hz; however, the measurement pixel resolution is extremely limited. High-speed measurements are a trade-off between framerate and pixel resolution. It is typically not feasible to obtain high-resolution images (10+ megapixels) at a high frame rate (100+ Hz).
Conversely, high-speed measurements with strain gages are straightforward and inexpensive. Commonly available acquisition units are capable of scan rates exceeding 10,000 Hz on multiple channels. Specialized units are capable of scan rates up to 250,000 Hz on a single channel.
Comparing DIC to String Potentiometers/LVDTs
DIC’s core functionality is measuring displacement over the test surface. Current commercially available equipment and software can achieve measurement accuracies near 0.001” (4 microns) with a measurement volume of approximately 7” x 5.5” x 5” (width x height x depth). Measurement volumes of up to 14 ft3 are possible, but with reduced accuracy (approximately 0.075”). An object anywhere in the measurement volume can be tracked in 3D with six DOF, assuming the tracking points remain visible.
By comparison, measuring displacement with a string potentiometer/LVDT provides only the displacement in the directional axis of the measurement. For some types of measurements, such as axial displacement or elongation, these devices are sufficient. However, if the measurement end points move in any direction other than the measurement axis, the off-axis displacement is either not captured or negatively affects the measurement. Also, string potentiometers/LVDTs must be installed on the object before testing occurs and must be aligned with the displacement direction. DIC allows addition of virtual extensometers before, during, and after testing anywhere on the captured surface. Unlike physical devices with space limitations, virtual extensometers can intersect and overlap without any issues.
DIC can utilize two methods for tracking displacements. One is the stochastic pattern mentioned previously, and the second is based on applying tracking dots. Tracking dots are stickers that can be placed on any surface without additional preparation (assuming the dots adhere). Figure 6 shows an example of an object with tracking dots. These tracking dots are independently tracked within the entire measurement volume. Multiple dots can be grouped together to provide more accurate object tracking, especially for objects that rotate within the FOV. Figure 7 is an example of tracking multiple objects in 3D.

Figure 6: Tracking Dots Placed on Object
Figure 7: Multiple Object Tracking in 3D
Summary
For measuring strains over a large area, DIC is often preferred over strain gages and offers many advantages. A single DIC measurement can replace up to thousands of strain gages by measuring the strain of the entire surface. Pointwise strain inspections can be applied anywhere on the measurement surface before, during, or after the measurement. In addition, custom areas can be created on the surface and then the maximum, minimum, and average strain results can then be extracted from within these areas.
However, not all strain measurement scenarios are appropriate for DIC. Low strain, high frequency, and internal surface strain measurements (such as in holes, on fasteners, or on inner diameters) are generally better suited for conventional strain gages, along with situations when full-field strain measurements are not required. For simple displacement measurements in a single direction, it is still generally preferred to use conventional devices.
DIC excels at displacement measurements and can be deployed on a wide variety of components and applications. DIC displacement data often provides more insight and understanding of overall component response than data from conventional methods. Adding additional displacement measurement points with DIC is quick and easy, with only additional sticker placement required.

Ryan E. Brister, P.E. – Associate, Houston Office
Ryan specializes in testing welded pipe and connectors in a resonant bending fatigue environment as well as, the fixture design for individual testing requirements that necessitate individual or simultaneous applications of force, pressure, torque, and temperature. He is also experienced in data acquisition systems, device selection, and measurement methods. Mr. Brister has a BS in Aerospace Engineering and a MS in Mechanical Engineering from Texas A&M University. He is a registered professional engineer in Texas.


Leave a Comment Cancel reply
You must Register or Login to post a comment.